
Here are some charts that reflect our areas of focus this week at XLU Leads with New High Even though the Utilities SPDR (XLU) cannot keep pace with the Technology SPDR (XLK) and Communication Services SPDR (XLC), it is in a leading uptrend. XLU formed a cup-with-handle from November to July and broke to new highs the last two weeks. ...

Is the market’s next surge already underway? Find out with Tom Bowley’s breakdown of where the money is flowing now and how you can get in front of it. In this video, Tom covers key moves in the major indexes, revealing strength in transports, small caps, and home construction. He identifies industry rotation signals, which are pointing to aluminum, recreational products, ...

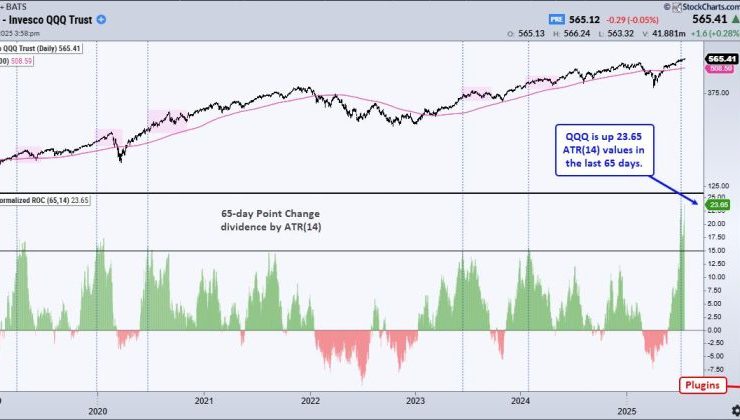
The S&P 500 ($SPX) just logged its fifth straight trading box breakout, which means that, of the five trading ranges the index has experienced since the April lows, all have been resolved to the upside. How much longer can this last? That’s been the biggest question since the massive April 9 rally. Instead of assuming the market is due to roll ...
Markets don’t usually hit record highs, risk falling into bearish territory, and spring back to new highs within six months. But that’s what happened in 2025. In this special mid-year recap, Grayson Roze sits down with David Keller, CMT, to show how disciplined routines, price-based signals, and a calm process helped them ride the whipsaw instead of getting tossed by ...
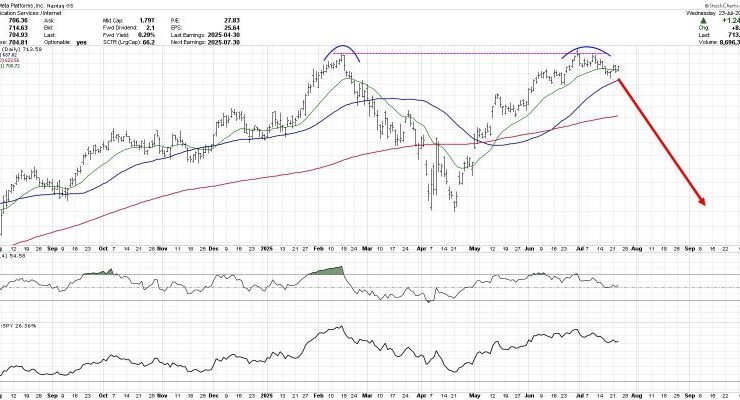
The chart of Meta Platforms, Inc. (META) has completed a roundtrip from the February high around $740 to the April low at $480 and all the way back again. Over the last couple weeks, META has now pulled back from its retest of all-time highs, leaving investors to wonder what may come next. Is this the beginning of a new ...

The stock market feels like it’s holding its breath ahead of Big Tech earnings. The first two days of the trading week were mostly quiet, but Tuesday gave us a few nuggets worth chewing on. The S&P 500 ($SPX) squeaked out another record close, up by a modest +0.06%. It’s barely a blip, but it keeps the uptrend intact. Tech ...
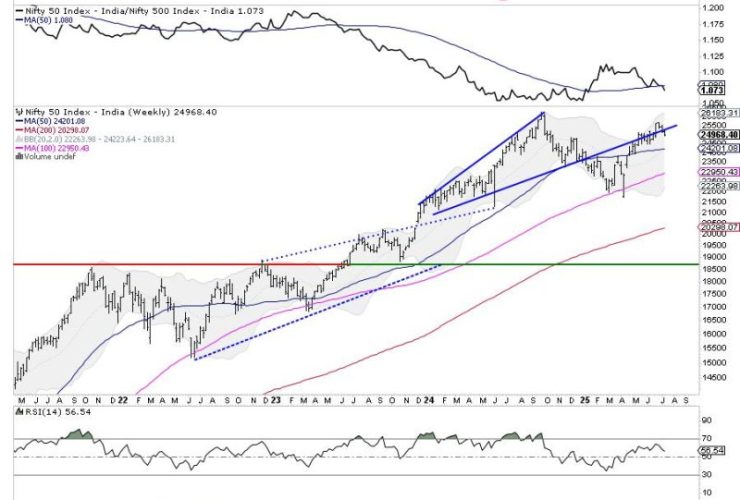
The Nifty traded in a broadly sideways and range-bound manner throughout the previous week and ended the week with a modest decline. The Index oscillated within a narrow 276-point range, between 25144.60 on the higher end and 24918.65 on the lower end, before settling mildly lower. The India VIX declined by 3.60% over the week to 11.39, suggesting continued complacency ...
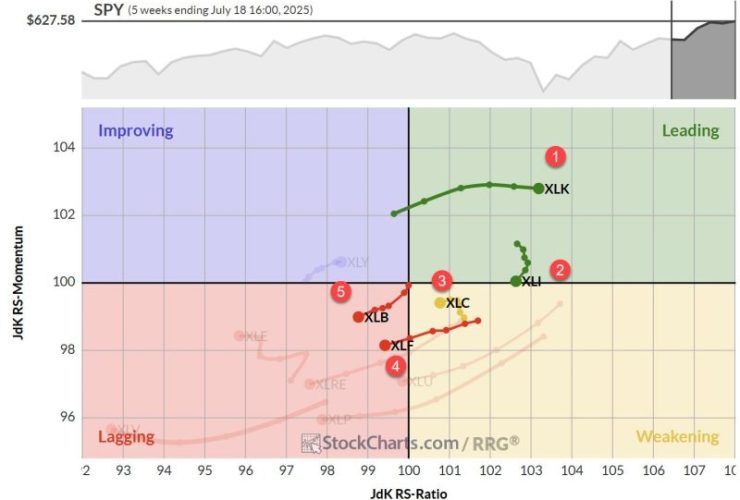
Sector Rotation Stalls, Tech Remains King Despite a slight rise in the S&P 500 over the past week, the sector rotation landscape is presenting an intriguing picture. For the first time in recent memory, we’re seeing absolutely no changes in the composition of the sector ranking — not just in the top five, but across the board. Will this stability ...
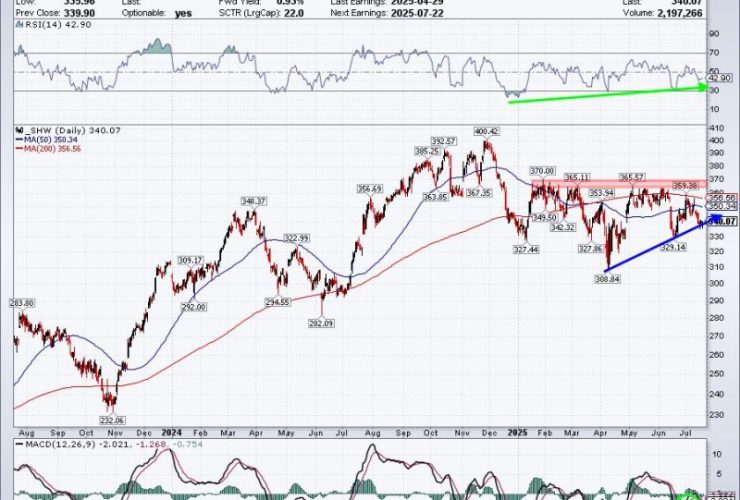
This week, let’s dive into three interesting stocks: a well-known Dow stalwart, a tech giant in a tug of war, and a former Dow member showing signs of revival. Whether you’re looking for opportunity, caution, or something worth watching, there’s a little something here for every thoughtful investor. Sherwin-Williams (SHW): Painting a Better Picture? Sherwin-Williams, Co. (SHW) comes into earnings ...

Even with a few short-lived roller coaster rides, the stock market had a strong week. Though there was some selling on Friday, the S&P 500 ($SPX) and Nasdaq Composite ($COMPQ) closed up over the week as a whole, while the Dow Jones Industrial Average ($INDU) closed lower by 0.07%. Earnings season has started on a positive note, with big banks ...